Would you drive a sports car blindfolded? We hope not. But that’s what running Salesforce DevOps without tracking KPIs can feel like. It’s a high-stakes gamble that can turn your Salesforce development environment into a tangled mess.
But there’s a way to avoid this: keeping a close eye on KPIs and metrics.
As the renowned management consultant Peter Drucker said, “If you can’t measure it, you can’t improve it.”
With data guiding your decisions, insights become actions, challenges create opportunities, and bottlenecks are swiftly eliminated.
In this guide, we’ll dive into the essential metrics you should be tracking to enhance your Salesforce pipeline performance. We’ll explore how to speed up deployments, reduce errors, and drive success in your Salesforce DevOps initiatives.
Key Metrics for Tracking Salesforce Pipeline Performance
Which metrics matter most for Salesforce? The DevOps Research and Assessment (DORA) team highlights four key metrics:
1. Deployment Frequency
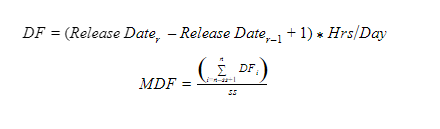
Deployment frequency (DF) measures how often your team successfully deploys code changes to production.
The more often you do this, the quicker your team can add new features or fix issues.
Instead of giant leaps that run the risk of bugs or even downtime, DF improves when your team takes smaller, frequent steps. They are easier to manage, being smaller in size, and help you consistently update your platform.
- In a high-performing organization, deployments can range from multiple times a day or even multiple times per hour.
- Lower performers tend to deploy weekly or bi-weekly, depending on resource availability.
The best practice is to deploy changes daily or at least weekly.
A high deployment frequency indicates a robust DevOps culture where small, incremental changes are regularly pushed to production, reducing the risk of major issues and downtime.
2. Lead Time for Changes
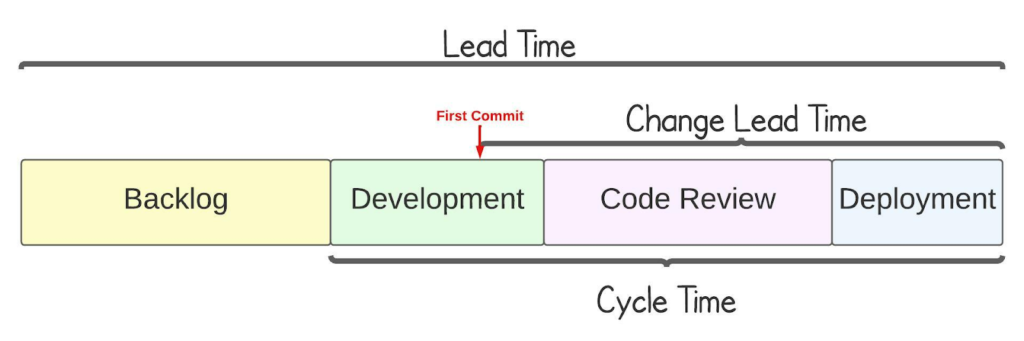
Lead time for changes (LTC) captures how long it takes from code being committed to it being deployed and available in production.
- High-performing, optimum teams have lead times of under a day
- Low performers can delay the lead time to multiple days or even weeks
Shorter lead times suggest that your team can quickly deliver new features and fixes, and your Salesforce DevOps is optimized for efficiency.
3. Mean Time to Recovery
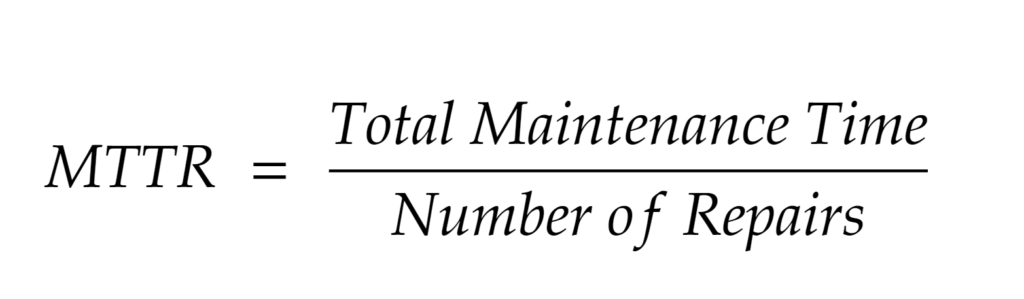
Mean time to recover (MTTR) measures how quickly your team can recover from incidents. In the context of Salesforce DevOps, this means the time it takes to fix a bug, resolve a performance issue, or restore service after a disruption.
- The best-case scenario is to recover within an hour or a few hours
- However, we’ve all seen cases of downtime spanning across an entire day or even multiple days
Rapid recovery from inevitable issues minimizes disruption to users and customers. It maintains business continuity. A shorter MTTR is desirable as it indicates that your team can quickly resolve issues, minimizing the impact on end-users — and in turn, the business.
4. Change Failure Rate

Change failure rate (CFR) tracks the percentage of deployments causing issues significant enough to require a hotfix, rollback, or immediate remediation.
- Well-established, experienced teams have a CFR under 15%
- The lower end of the spectrum sees over 45% of changes fail
A lower CFR indicates high release quality, stability, and risk management. This indicates that your team of developers is experienced, understands the system well, and can deploy efficiently. Failure deployments can damage data and save precious time in fixing bugs.
DORA metrics provide visibility into the efficiency of your Salesforce pipeline, thus improving the speed, agility, reliability, and scalability of your Salesforce DevOps systems.
But your data is spread across different tools and systems — getting your hands on these metrics can be difficult.
How to Identify Areas for Improvement in Your Salesforce Pipelines
Pipeline optimization is an ongoing journey. To get better results with your existing Salesforce pipelines, consistently monitor your metrics and look for opportunities to reduce friction. Here are a few simple steps to help you get started.
1. Analyze Pipeline Performance Data
Start by examining key performance indicators like deployment frequency, lead time, mean time to recovery, and change failure rate.
Look at the trends over time. Are deployments happening often enough? Is lead time increasing? Are failures creeping up? Any negative trends indicate potential problem areas.
2. Identify Trends and Patterns
Next, dig into the patterns behind the numbers. Inefficient processes will drag down velocity. Unnecessary complexities create headaches. Areas prone to errors put quality at risk. Identify where these issues are lurking in your pipelines.
3. Determine Areas for Improvement
Don’t just find the problems – understand why they are happening. If deployments are slow, is it due to manual hand-offs between teams? If the CFR is up, is it due to a lack of automated testing? Diagnose the root causes. List them down as areas of improvement.
4. Implement Strategies for Improvement
Once you’ve identified the areas for improvement, you can start implementing fixes. Look for ways to optimize processes, eliminate waste, and prevent defects from recurring. New tools and technologies can help, but also rethink your overall approach.
For example, an automated deployment tool can help you ship faster if deployments are a bottleneck. If test coverage improves, Salesforce DX can help with automated testing.
Optimize Your Salesforce Pipeline Performance!
Pipeline performance is a big deal in the world of Salesforce DevOps. It’s the key to working smarter, maintaining the integrity of your metadata, and efficiently driving success.
CI/CD tools help release updates 80% faster with your existing team and tools. It also provides a bird’s eye view of your whole Salesforce SDLC, so you can easily manage and deploy code from across your teams and platforms on a single dashboard.
The platform also syncs up your entire crew, spots and deploys changes, and avoids expensive mistakes with one-click rollbacks. With automated testing, security gates, and checks, it promptly notifies your teams to take action via email, Slack, Microsoft Teams, Jira, or ServiceNow. This proactive security approach seriously amps up your software delivery.
On top of that, deployment tools bring all your key metrics into one spot, no matter the app or platform. It offers over 150 KPIs with real-time data pulled straight from event logs. This 360-degree view helps you make faster decisions at each point, whether trying to cut costs, boost developer productivity, or benchmark your team